Displays more than one field from a database in a separate browser window.
Options
The Object Configuration Wizard Options tab shows the specific properties for the control.
| Height | Height of this object.
Default: 300 |
| Visible | Determines whether this control is visible. |
| Width | Width of this object.
Default: 400 |
| Chart Definition | The chart definition. |
| CSS Class | CSS class of this object. |
Common Uses
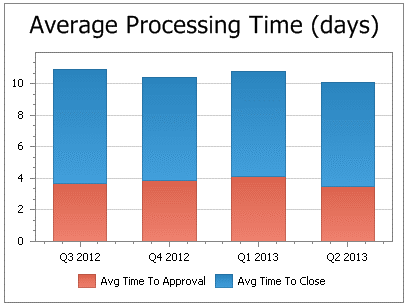
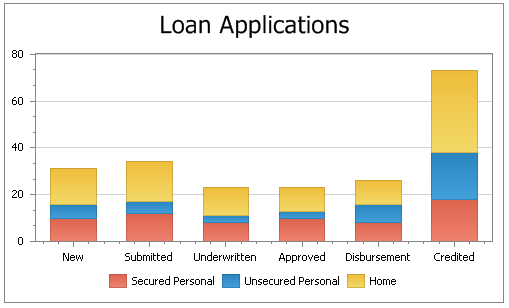
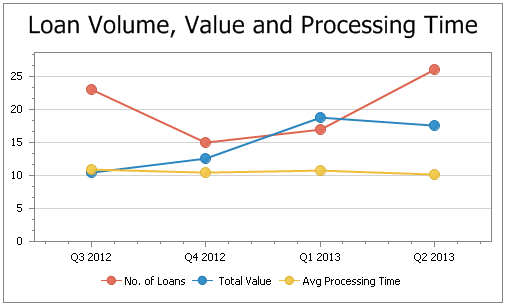
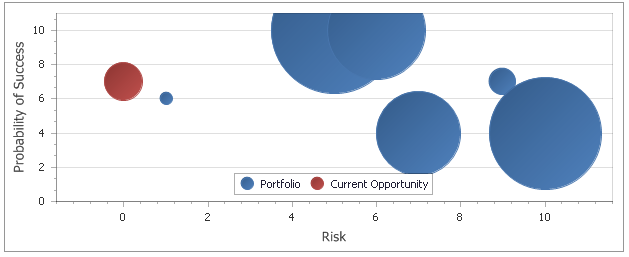
The chart is often used to display data in a graphical format to the end user. Charts can display either single series or multiple series data.
How to Use
Prerequisites
- A Process Group, Process, and ActivityA specific step in a process. It will be the user interface for that step (web form or a screen), for example, the Leave Application (screen interface or web form) will be the first Activity in the Leave Requisition process. The Leave Application Authorization will be the second step or Activity in the Leave Requisition process. One Process can have multiple activities. already created.
For more information, see Process Model.
Configure the Object
This procedure describes how to configure the Object.
- Double-click the Activity. The Layout tab is displayed.
- Drag an Activity Control Object from the Activity Designer to the Layout tab. The Object Configuration Wizard is displayed.
- Click in the Name text field and select the name Object and type your Object name. For example, CH1050Chart.
Note the Name text field cannot contain any spaces. - Click in the Caption text field and replace the text with the object name which you want displayed. For example, Chart.
- Click the Options tab and configure using the previously defined fields.
- Click OK.
- On the ribbon, click the File tab, click Save or press CTRL+S to save your changes.
- To provide the data for the Chart, the integration wizard can be used. For more information, see XMPro Integration Wizard.
- To provide the data for the Chart, the Chart Fast can be used. For more information, see How to use a Chart Control Fast Field.
Examples
Consideration
- When using the Integration Wizard make sure to map all the returning columns to the chart object


