How Can We Help?
Prerequisite Checks
- Before you create/debug a use case, refer to this article to make sure the Data Stream DesignerIs a model-driven approach to connect, transform and action real-time “streaming” data in a visual, drag and drop manner. and the Stream HostIs a client application which hosts/executes the Use Cases designed by the user in the IoT Portal. are installed properly and working.
- Run the Integrity check on the use case you want to debug and make sure there are no errors reported. The ‘Integrity Check’ button is available in the action bar.
Once the prerequisite checks are completed, follow these steps to debug a use case:
1. Live Data View
The easiest and simplest option to debug a use case is by using Live Data View. To view data from any agent, follow these steps:
-
- Publish the use case if not already published
- Click the ‘Live View’ button in the action bar

-
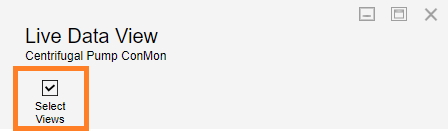
- This will open the ‘Live Data View’ blade, it may prompt you to select (if not previously selected) agents to view the data output from. You can change the agent selection by clicking on ‘Select Views’ button in the Live Data View pane.
-
- Once the agents are selected, data output from those agents will be displayed in the Live Data View pane.
Note: You may have to wait for the data to be displayed here depending on the polling frequency of the use case and/or other criteria which may output the data only in certain cases and/or at longer intervals. - Based on the data displayed in Live Data View, you can verify whether the use case/agents are running or not and validate the correctness of data and then make necessary changes to the use case/agents as needed.
- Once the agents are selected, data output from those agents will be displayed in the Live Data View pane.
2. Error Endpoint on the Agent
If the data output is not shown in Live Data View for any of the agents, then there could be an issue with the agent/use case setup. To check if there are any errors reported by the agent, you can use the Error endpoint (if available) on the agent. Drag an ‘Event Printer’ agent to the canvas and connect it with the Error output endpoint of the agent you want to debug. Use the live view on this Event Printer agent to see if any errors are being generated by the agent.

3. Stream Host Logs
If the data output is not shown in Live Data View for any of the agents, then there could be some issue with the use case setup. If there are any errors reported by the use case, you can view them under StreamConsists of a combination of Stream Objects allowing real-time data to flow through. It is created to address a particular use case. Host logs screen.
To access stream host logs:
-
- From the menu, click on ‘Collections’
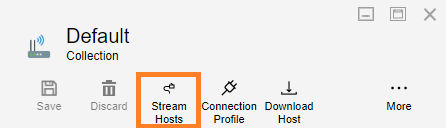
- Click the collectionIs a virtual grouping of Stream Hosts. All Stream Hosts in a collection are broadcasted the same instructions from the IoT Portal. This way a Use Case can be mass deployed to all the Stream Hosts in a given Collection. that the use case is using
- Click on ‘Stream Hosts’ button in the action bar
-
- In the Stream Hosts pane, click on the stream host that is running the use case
- In the Host Logs pane, errors reported by the use cases that are running on this stream host will be displayed
- Look for any errors reported since the time the use case is published
- You can specify the Date and Time range to filter the errors and sort them by Timestamp column to narrow down the list
- If there are any errors, make necessary changes to the agents/use case
Comments are closed.