How Can We Help?
Introduction
The Selenium IDE is a browser extension that records your actions and converts it into useable code that you can add to your Selenium Project, or just run it from the Selenium IDE itself. While it doesn’t always generate perfect code, it’s a good starting point for learning how to use Selenium and for simple tests.
Installing Selenium IDE
You can find the Selenium IDE at https://selenium.dev/downloads/
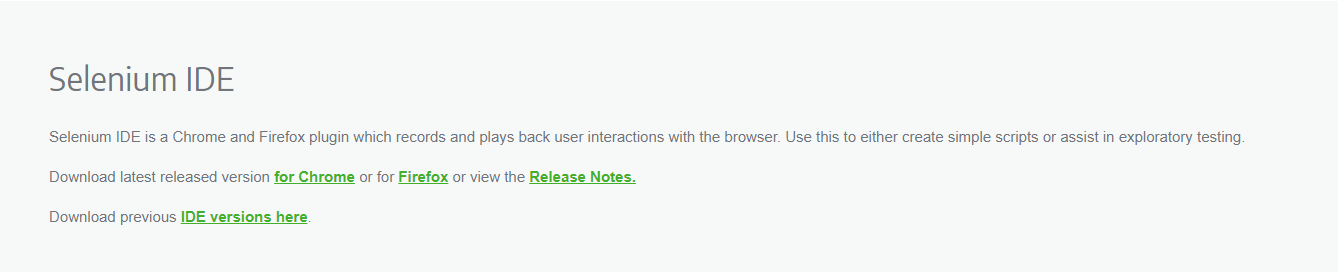
For this document we’ll be using the Chrome version, but it’s also available for Firefox if you prefer.
Using Selenium IDE
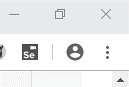
Once you have it installed, click the Se icon in the top right of your browser to open it up.
Selenium IDE will open up in a new window, and ask what you’d like to do.
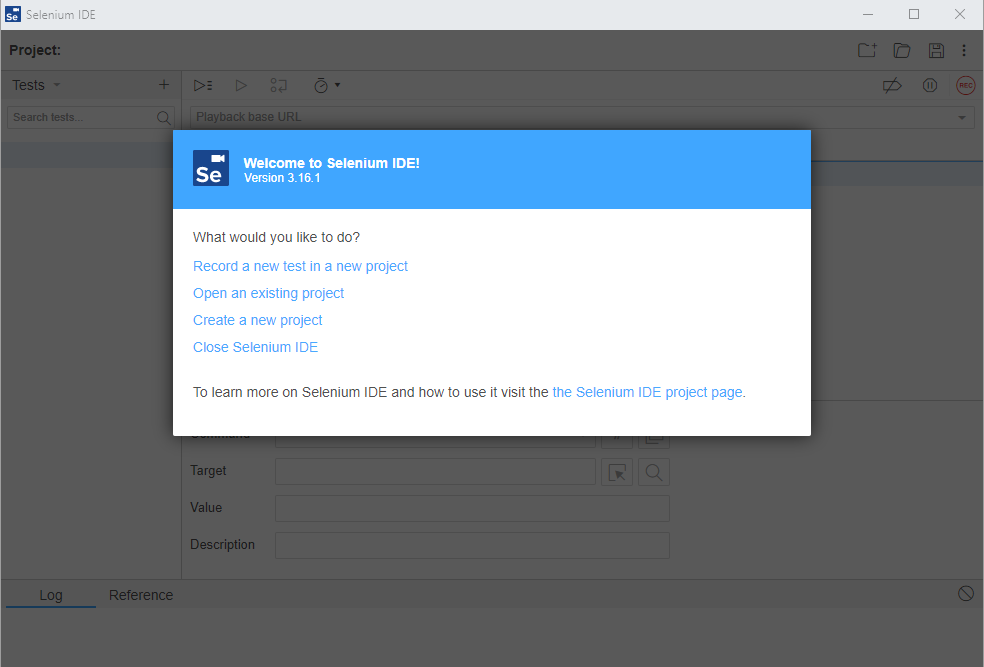
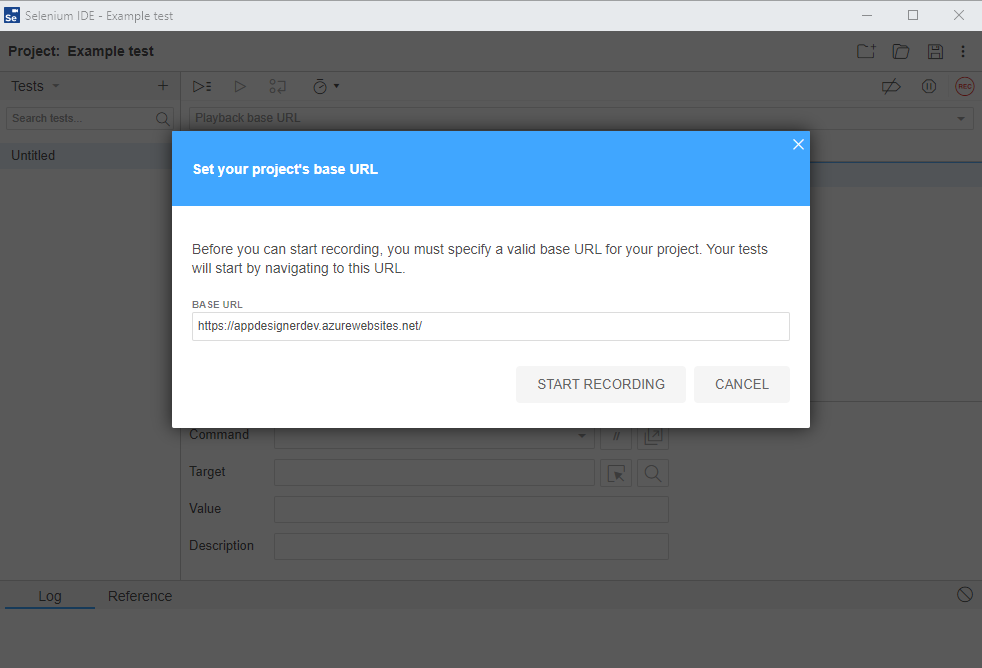
If you’d like to start recording a test straight away, click Record a new test in a new project. Enter a name for your project and the URL of the site you’d like to start on, and click Start Recording.
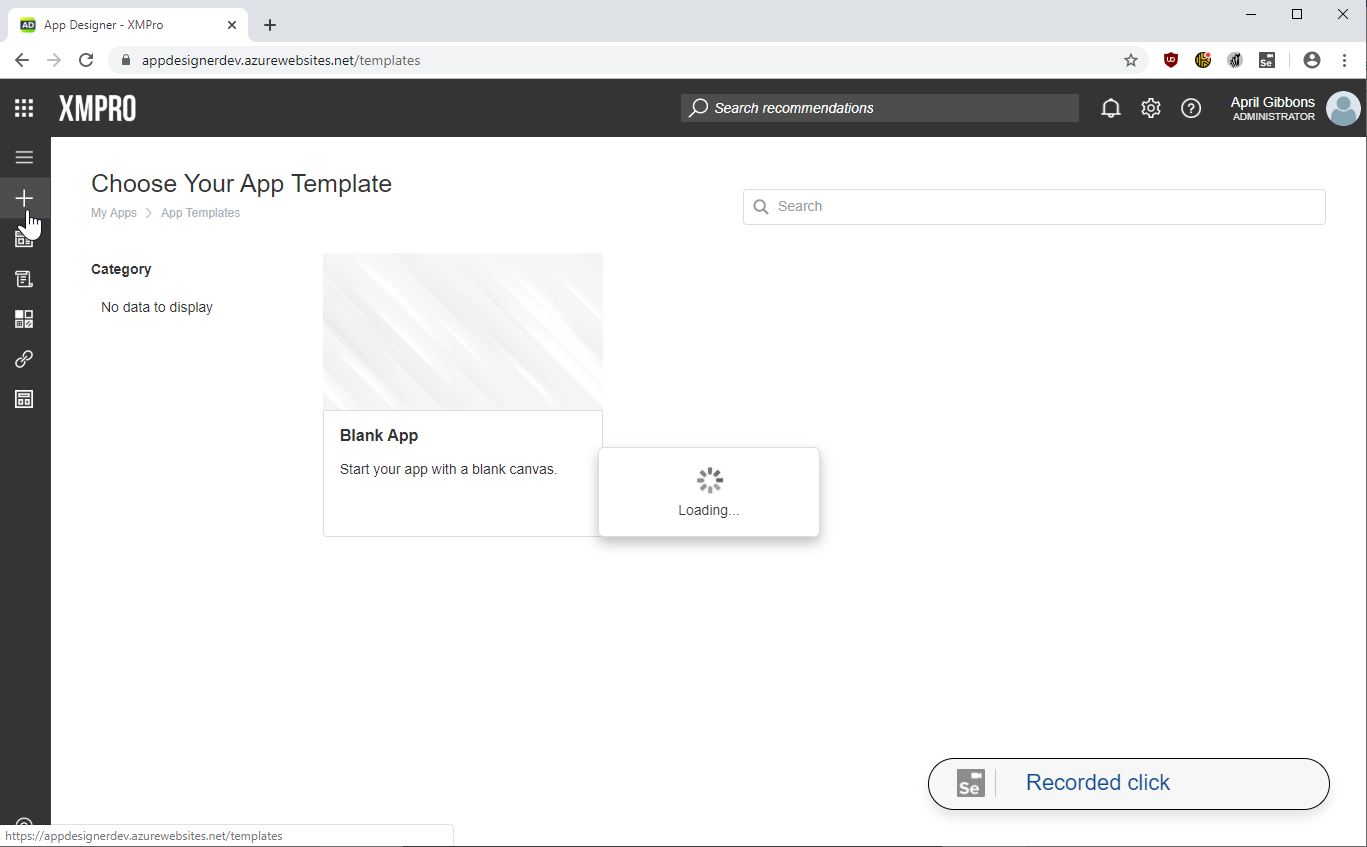
Selenium IDE will open a new browser window at the URL you specified, and start recording your actions. You can see when Selenium IDE is running by the bar down in the bottom right corner.
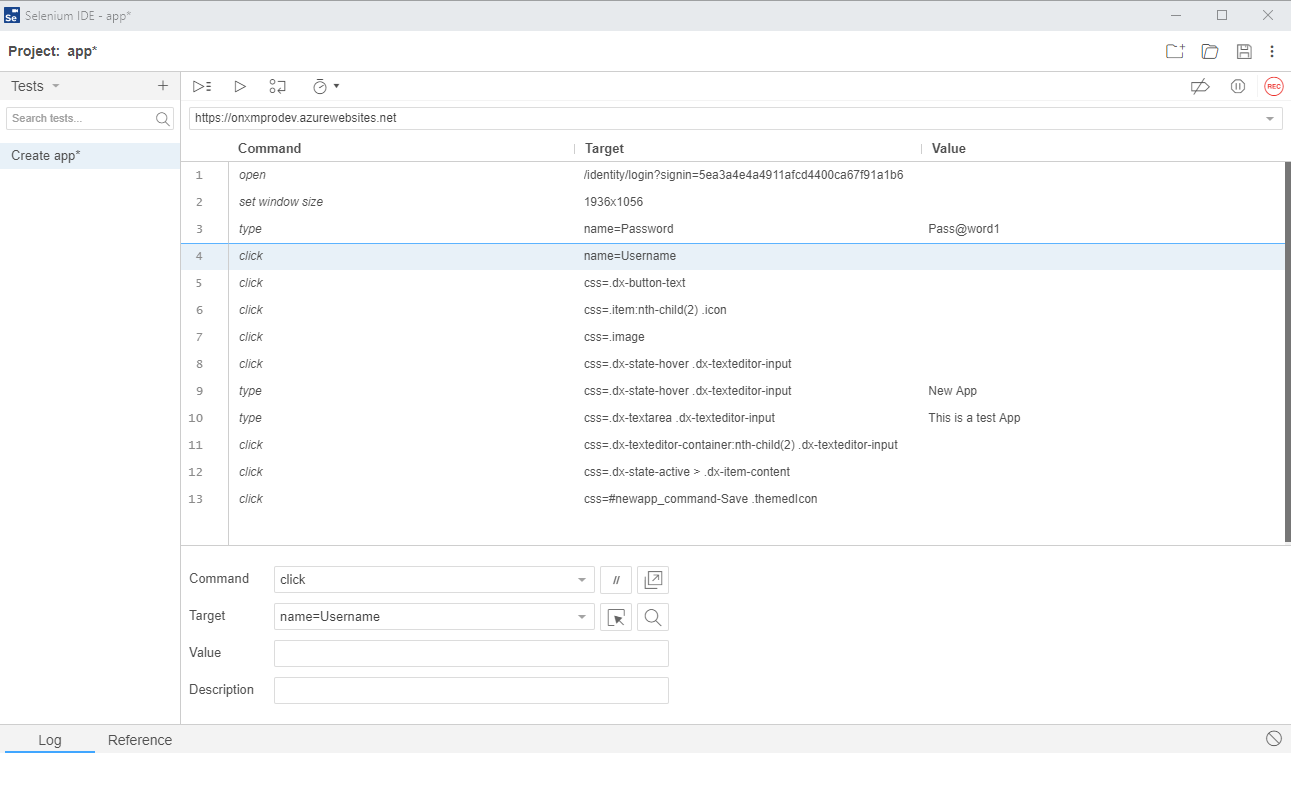
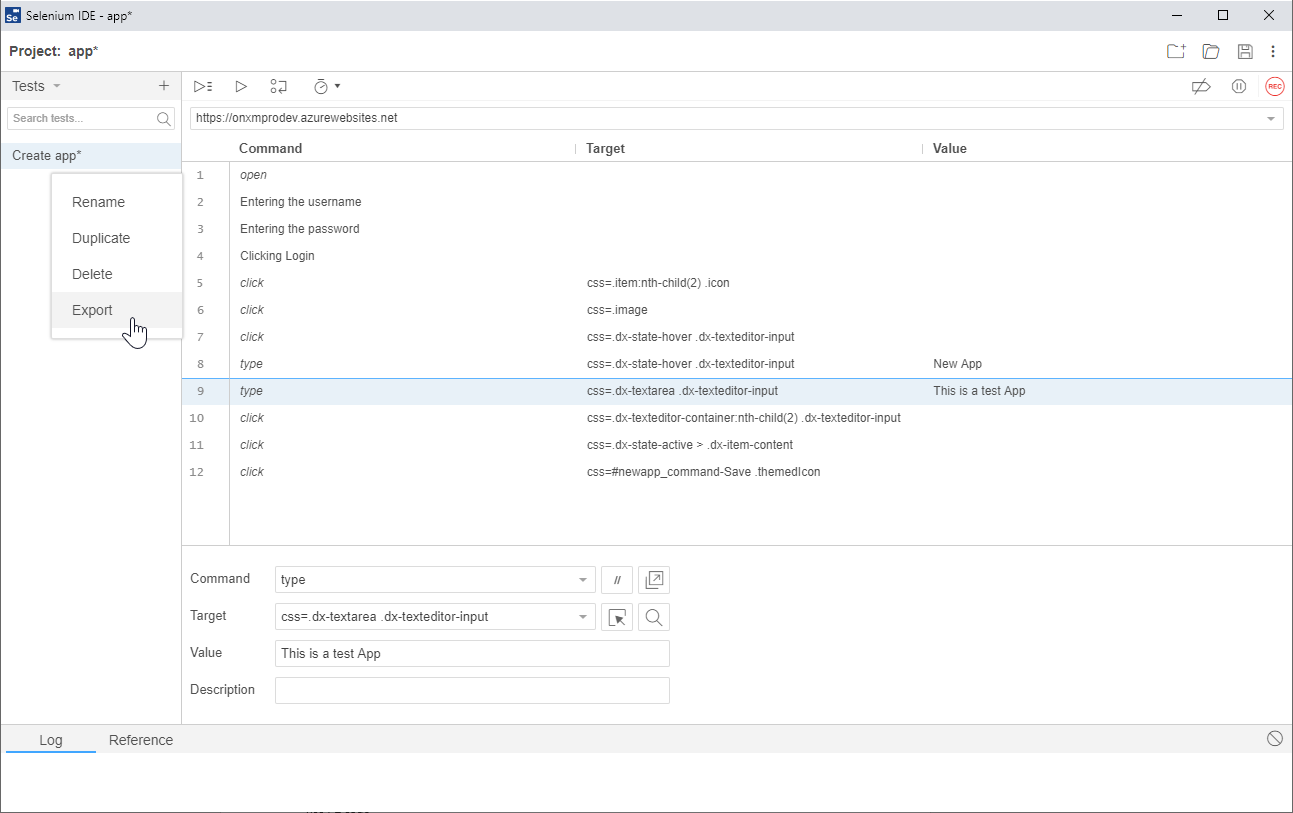
Once you have recorded the steps you’d like, switch back to the Selenium IDE window and click Stop Recording. The steps you have recorded will look like this:
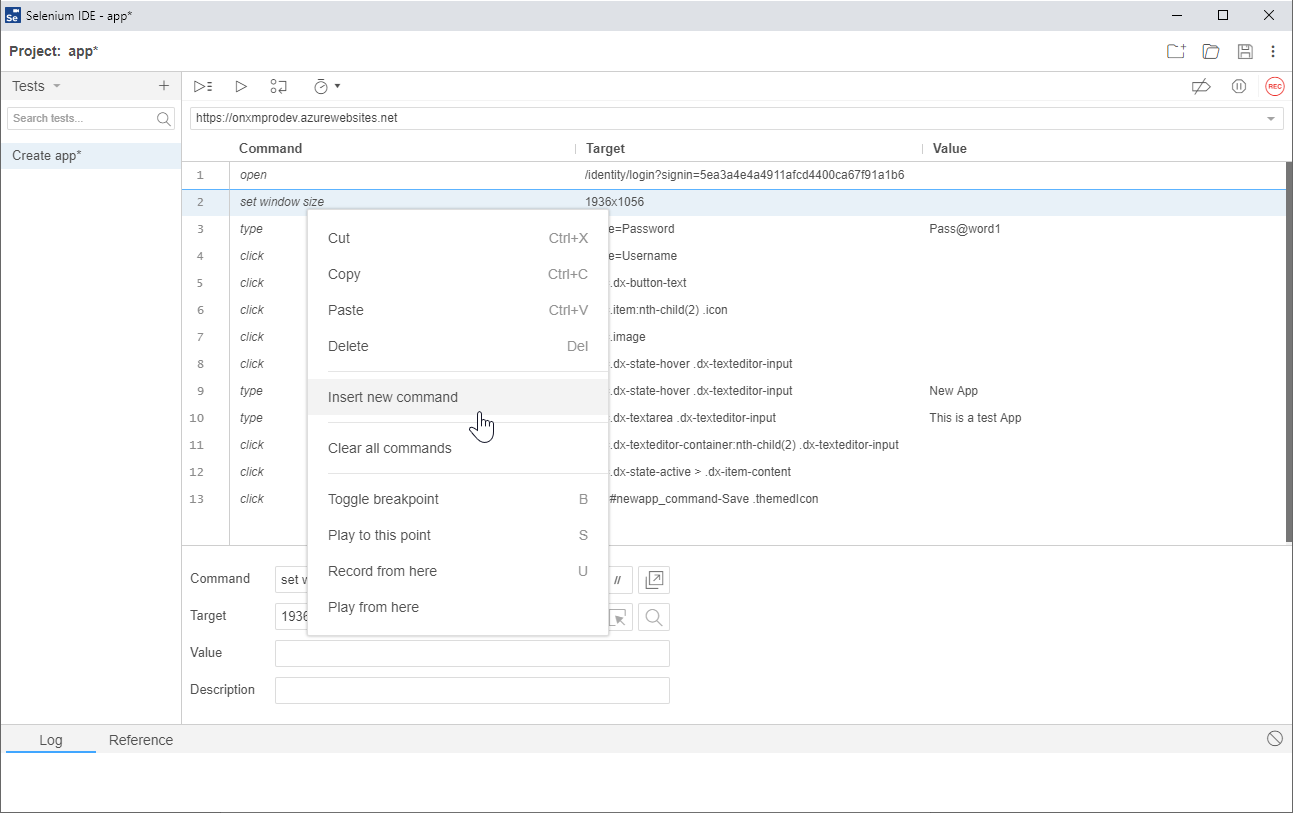
You can edit steps by clicking on them, drag them to move them around, or right-click for more options. You can also add Descriptions to your steps to help you remember what each one does.
Running tests from Selenium IDE
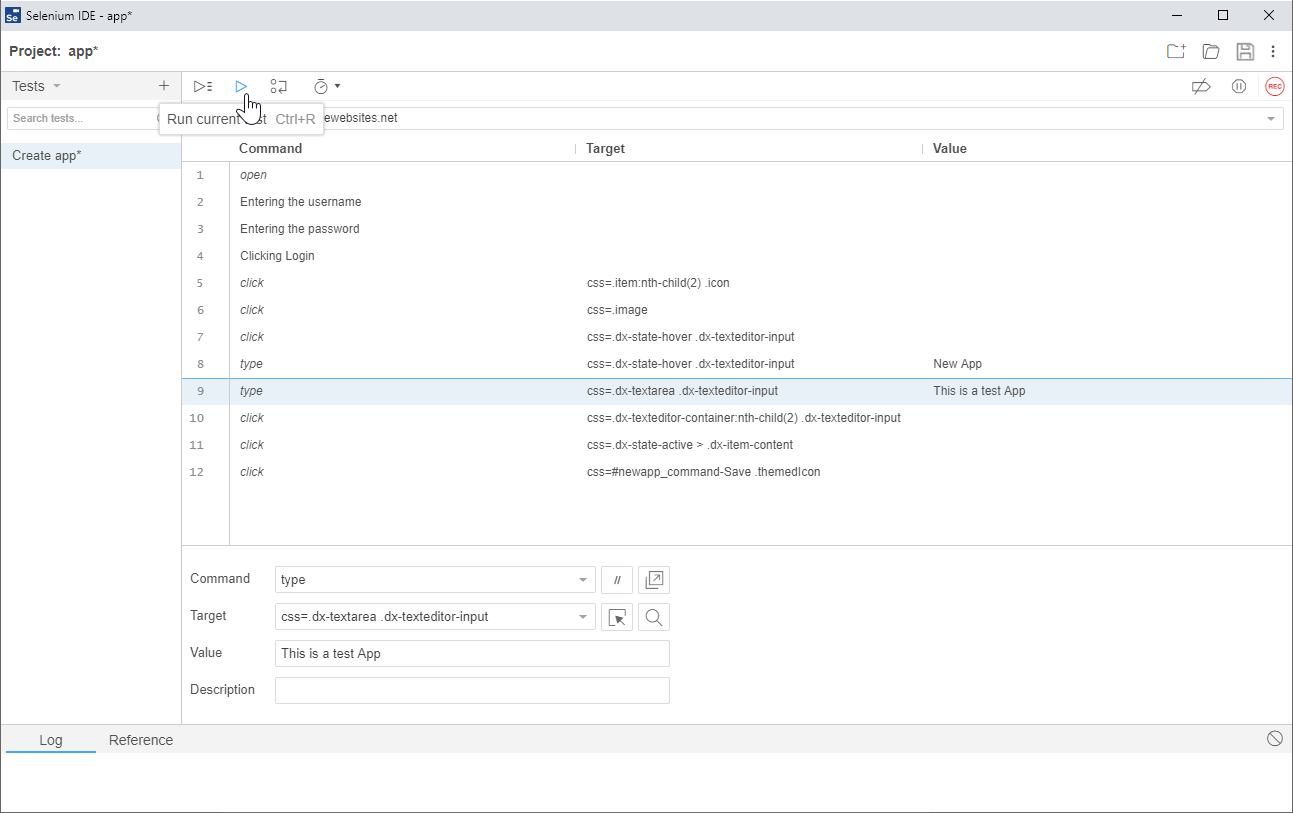
If you’d like to quickly see how your test performs, you can run it from the Selenium IDE by clicking either Run current test or Run all tests. If you logged in to a site during your test, make sure you log out before running the test, as the Selenium IDE doesn’t run in a clean session.
Exporting to and running from your Selenium Visual Studio project
However, if you’ve created a Selenium Visual Studio project, you can export these steps to ready-to-use C# code. Mouse over the test you’d like to export, click the 3 dots icon, then click Export.
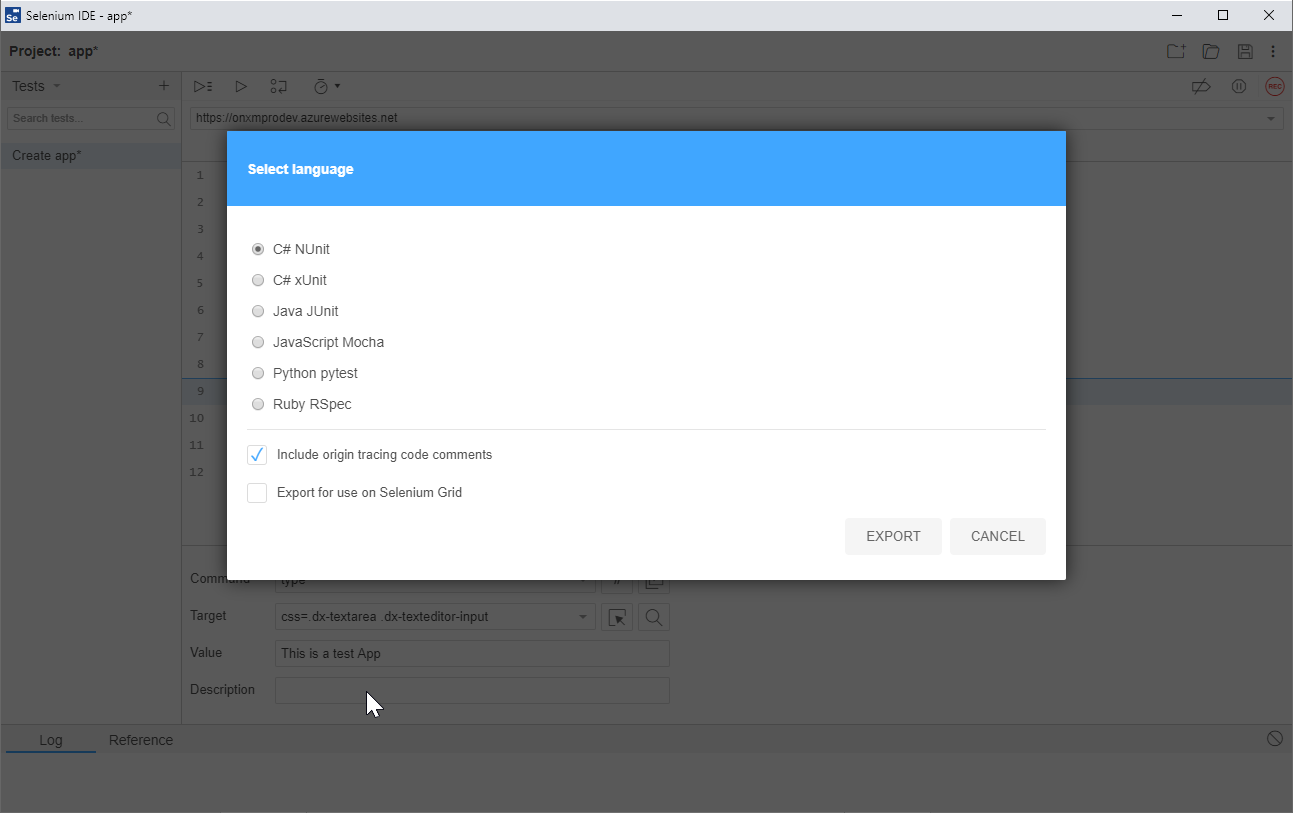
You will be presented with a couple of options. Select C# NUnit and Include origin tracing code comments, then click Export and save your file.
The steps you exported will end up looking like this, alongside some setup code:
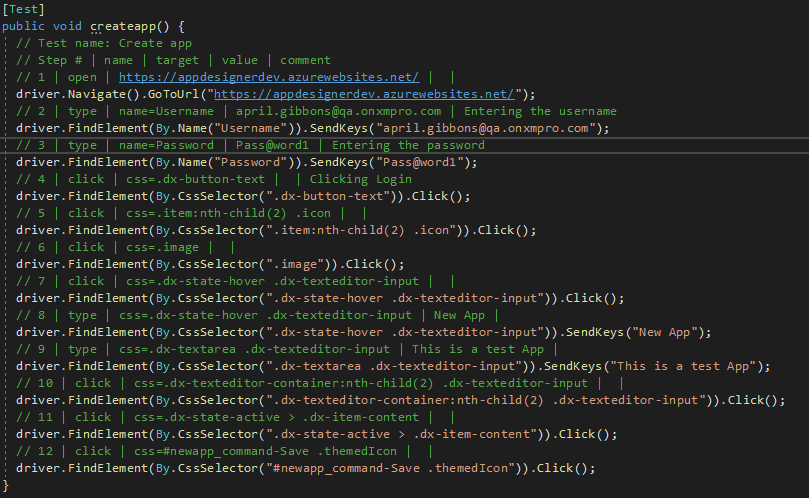
If you’ve set up a project according to the Setting up Selenium in Visual Studio for Automated UI Testing KB article, you can add the exported code straight to your project and it will run! To view the tests that can run, go into Views, and click Test Explorer.
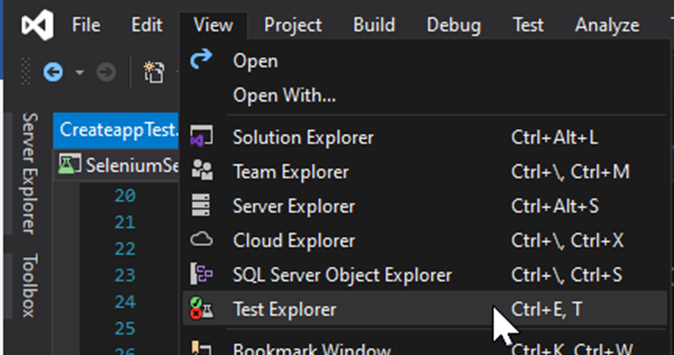
For the Test Explorer, you can see all of your tests run/debug them, and see the results for group or individual tests.
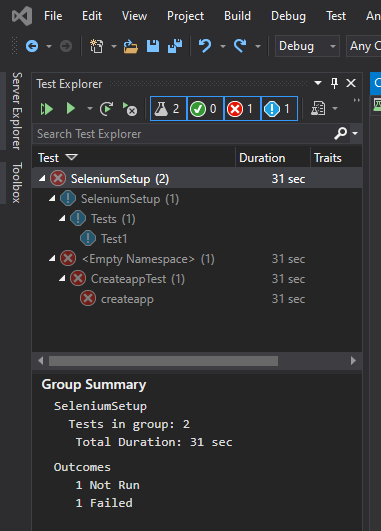
Running a test will open up your browser in a clean session, so no need to reset your browser when running from Visual Studio. The running tests will look like this:
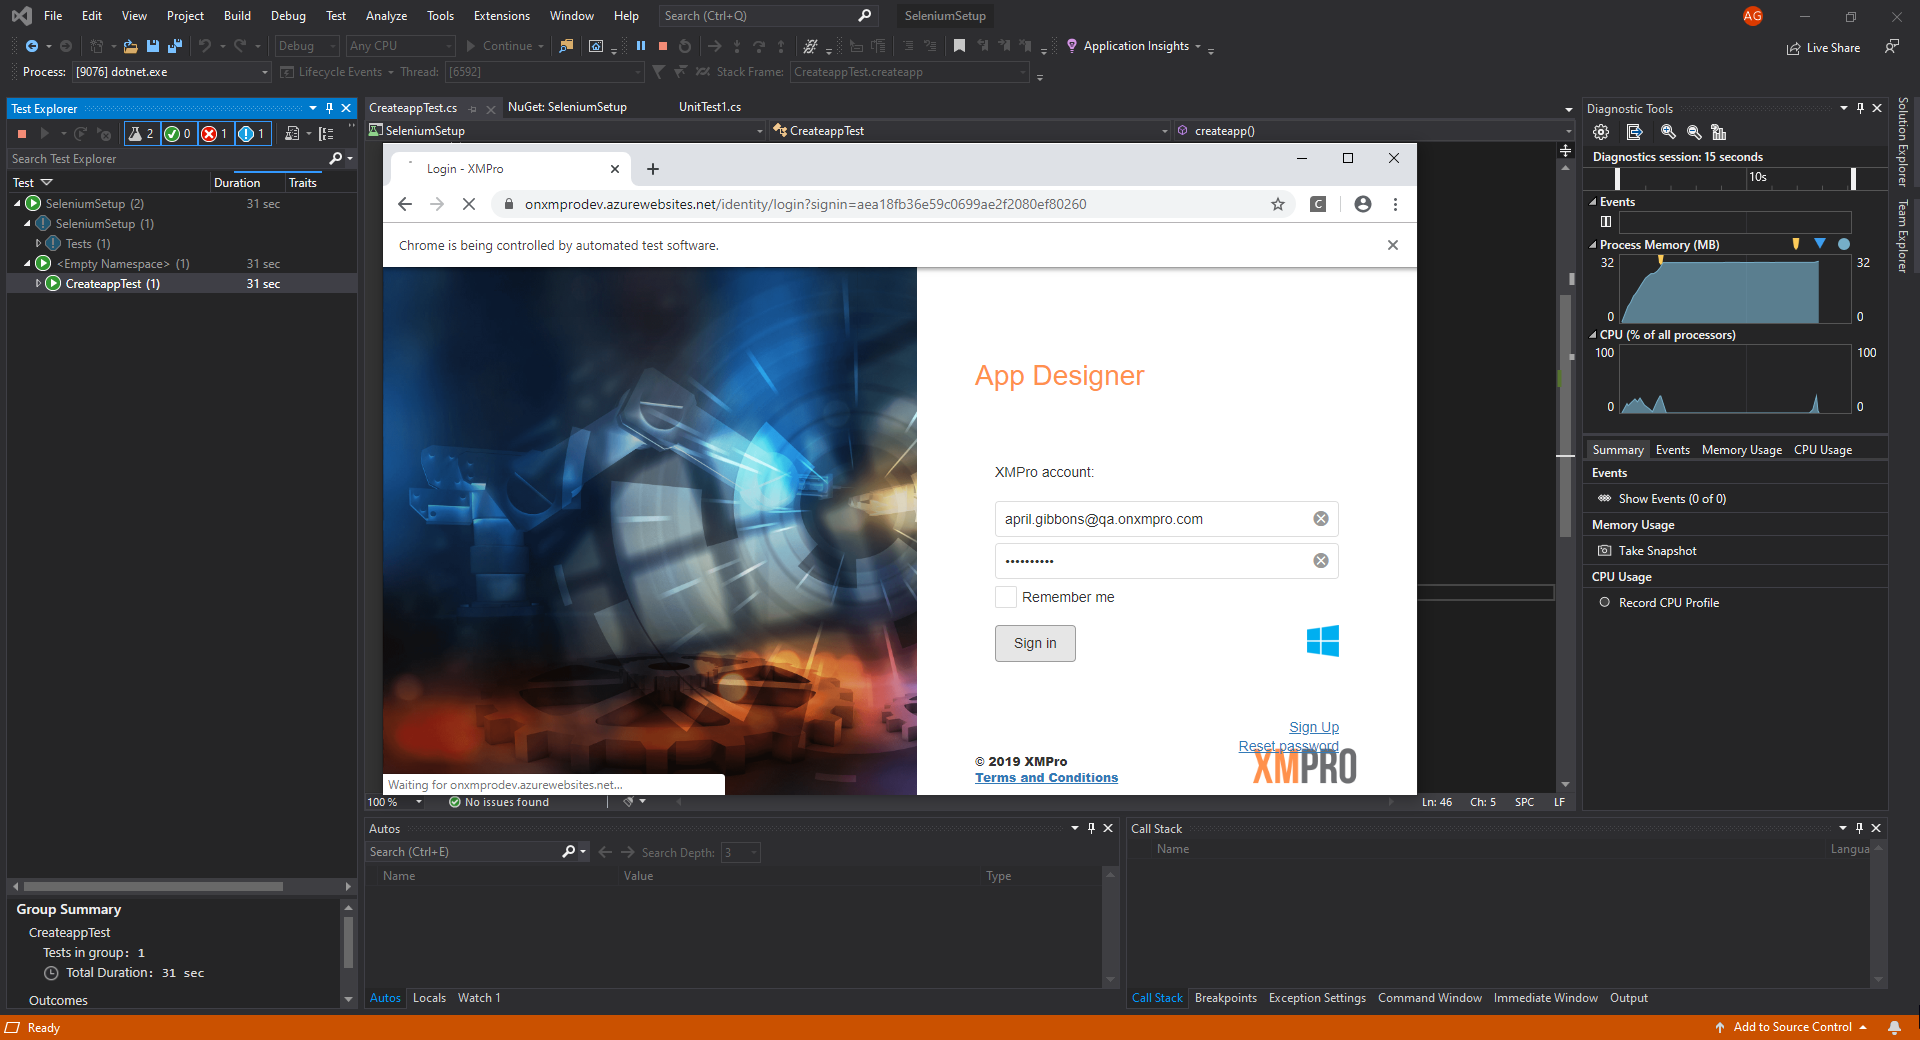
Once the tests are done, the browser will close, and Visual Studio will show you which tests passed and failed. If you’re debugging the tests, the execution will pause when a step fails and take you to it, so you can check if its an issue with the test code or a bug in what you’re testing.
Comments are closed.