How Can We Help?
One of the benefits of using Selenium is that it can be integrated into your Azure building/publishing pipeline, so that when a new build is pushed, it will automatically be tested and give you the results. You can set up agents to run on a Windows, MacOS and Linux, using Chrome, Firefox, Internet Explorer and Safari (however tests will run best in Windows+Chrome).
Setting up your Build Pipeline
The only change you’ll need to make to your Build Pipeline is adding a task to copy your test project to the Staging Directory.
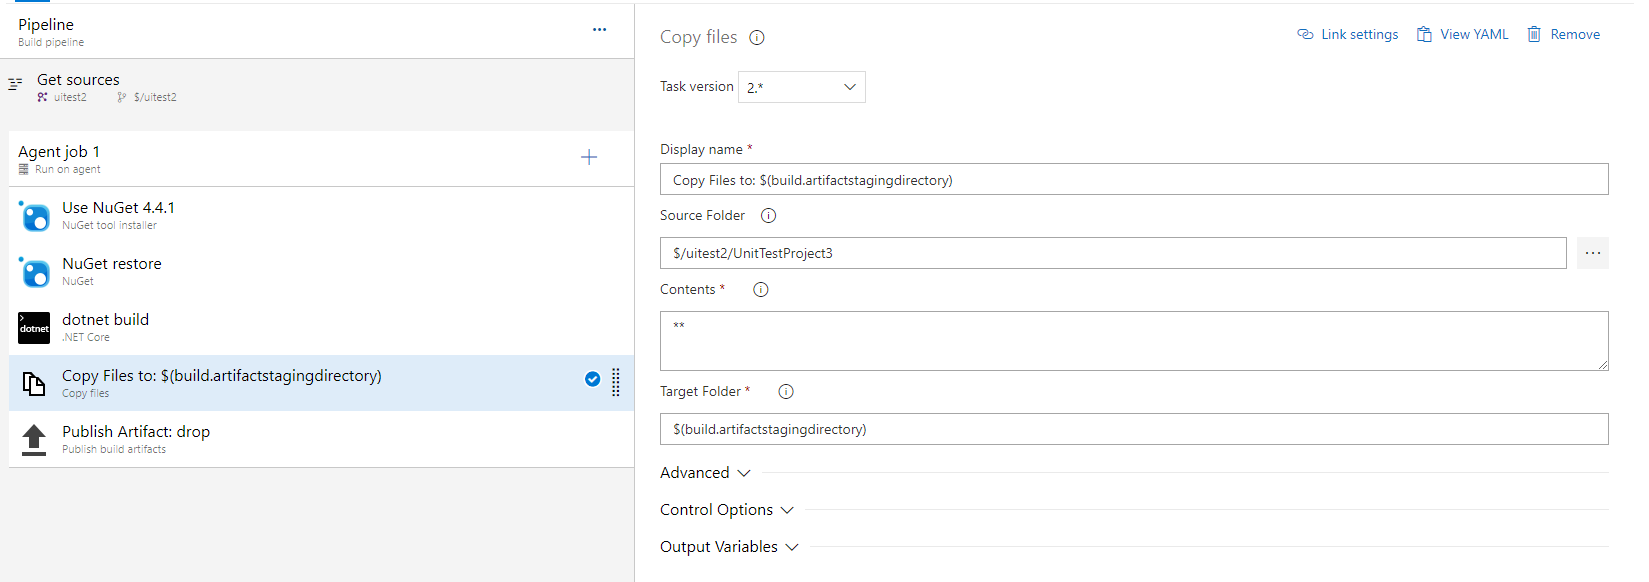
Make sure to add it before your Publish task, as files added after that won’t be included.
Setting up your Release Pipeline
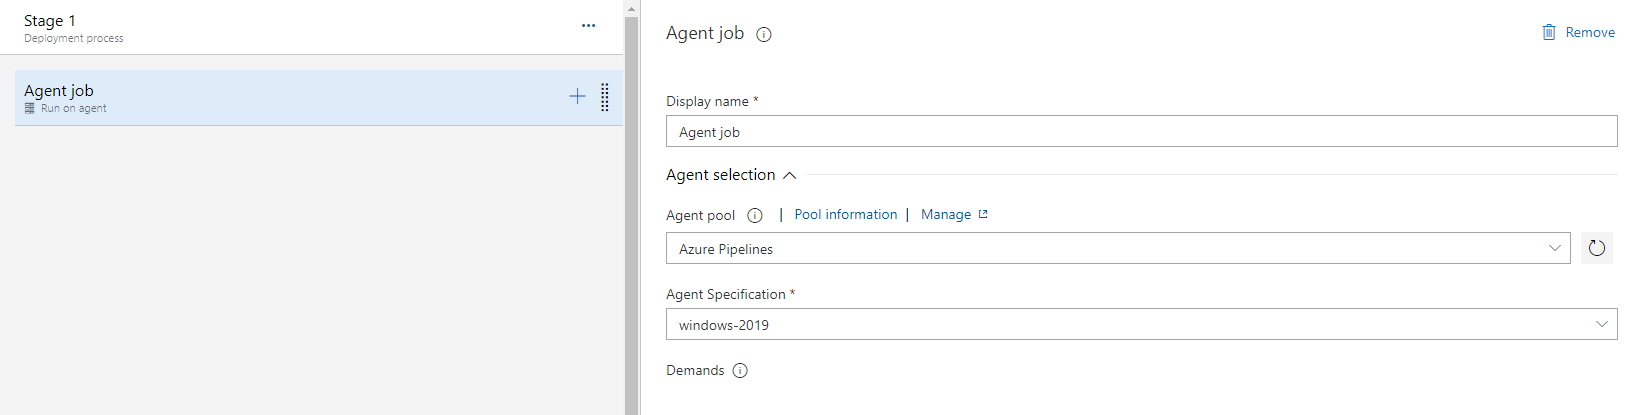
This is where your tests will be run. First, add a new Stage after your publishing stage, and add a new Agent, using whatever OS you want to test with.
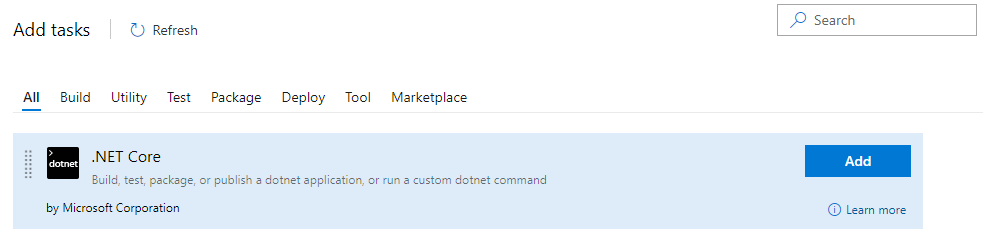
You’ll then want to add a new .Net Core task to your agent.
The setting you’ll need to set are:
- Display Name
-
- Set to the Operating System/Browser combination you’re using, as this is what your tests will be grouped under in the results.
-
- Command
-
- Set to test.
-
- Path to project(s)
-
- Point this to the path of your test project. If the only project you’ve sent to the staging directory is your test project, **/*.csproj should work.
-
- Arguments
-
- If your project has a .runsettings file, add ‘-s pathtorunsettings’
- -noderesuse:false will stope nodes from being reused. Best to include this as there are some issues with nodes hanging around after a test is complete.
- -v n sets the logging to normal verbosity.
-
If everything is configured correctly, your tests should now run after your builds.
Getting Test Results
There are two different test results pages in Azure, one in the Release Pipeline and one in Test Plans.
Release Pipeline results
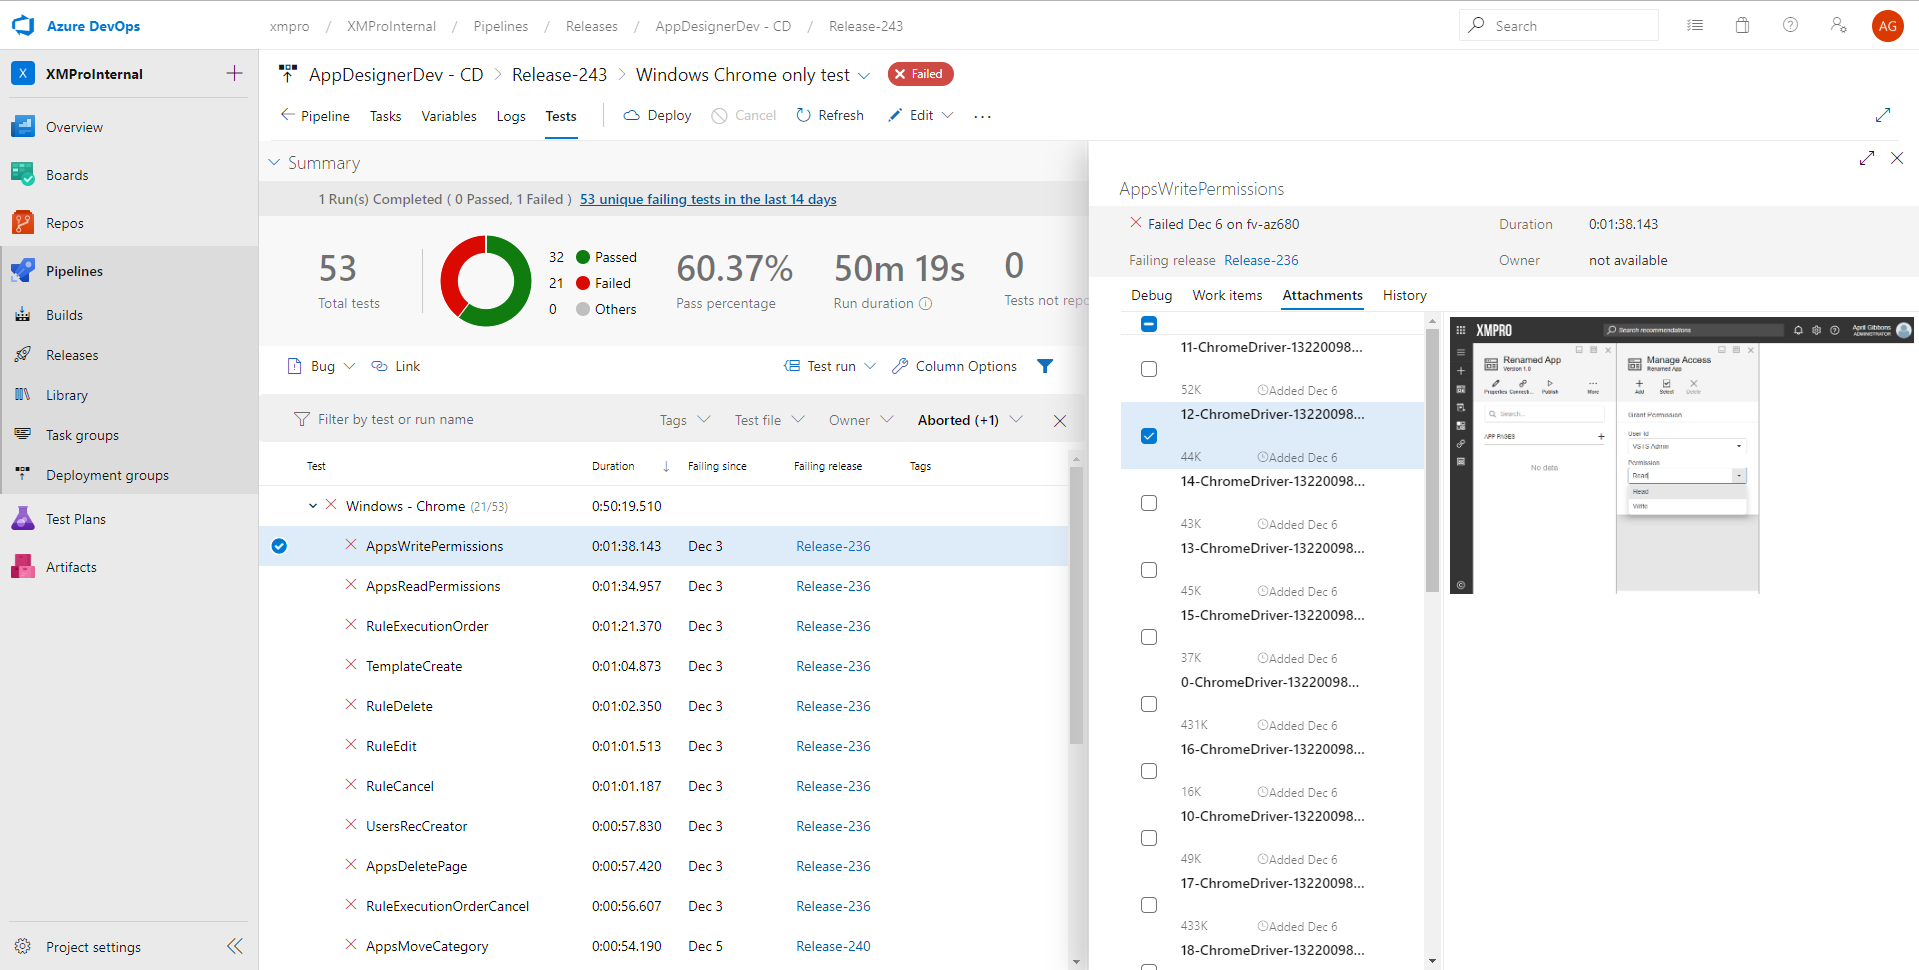
You can access the Release Pipeline’s test results page by going into your Release and clicking Tests. The page will look something like this:
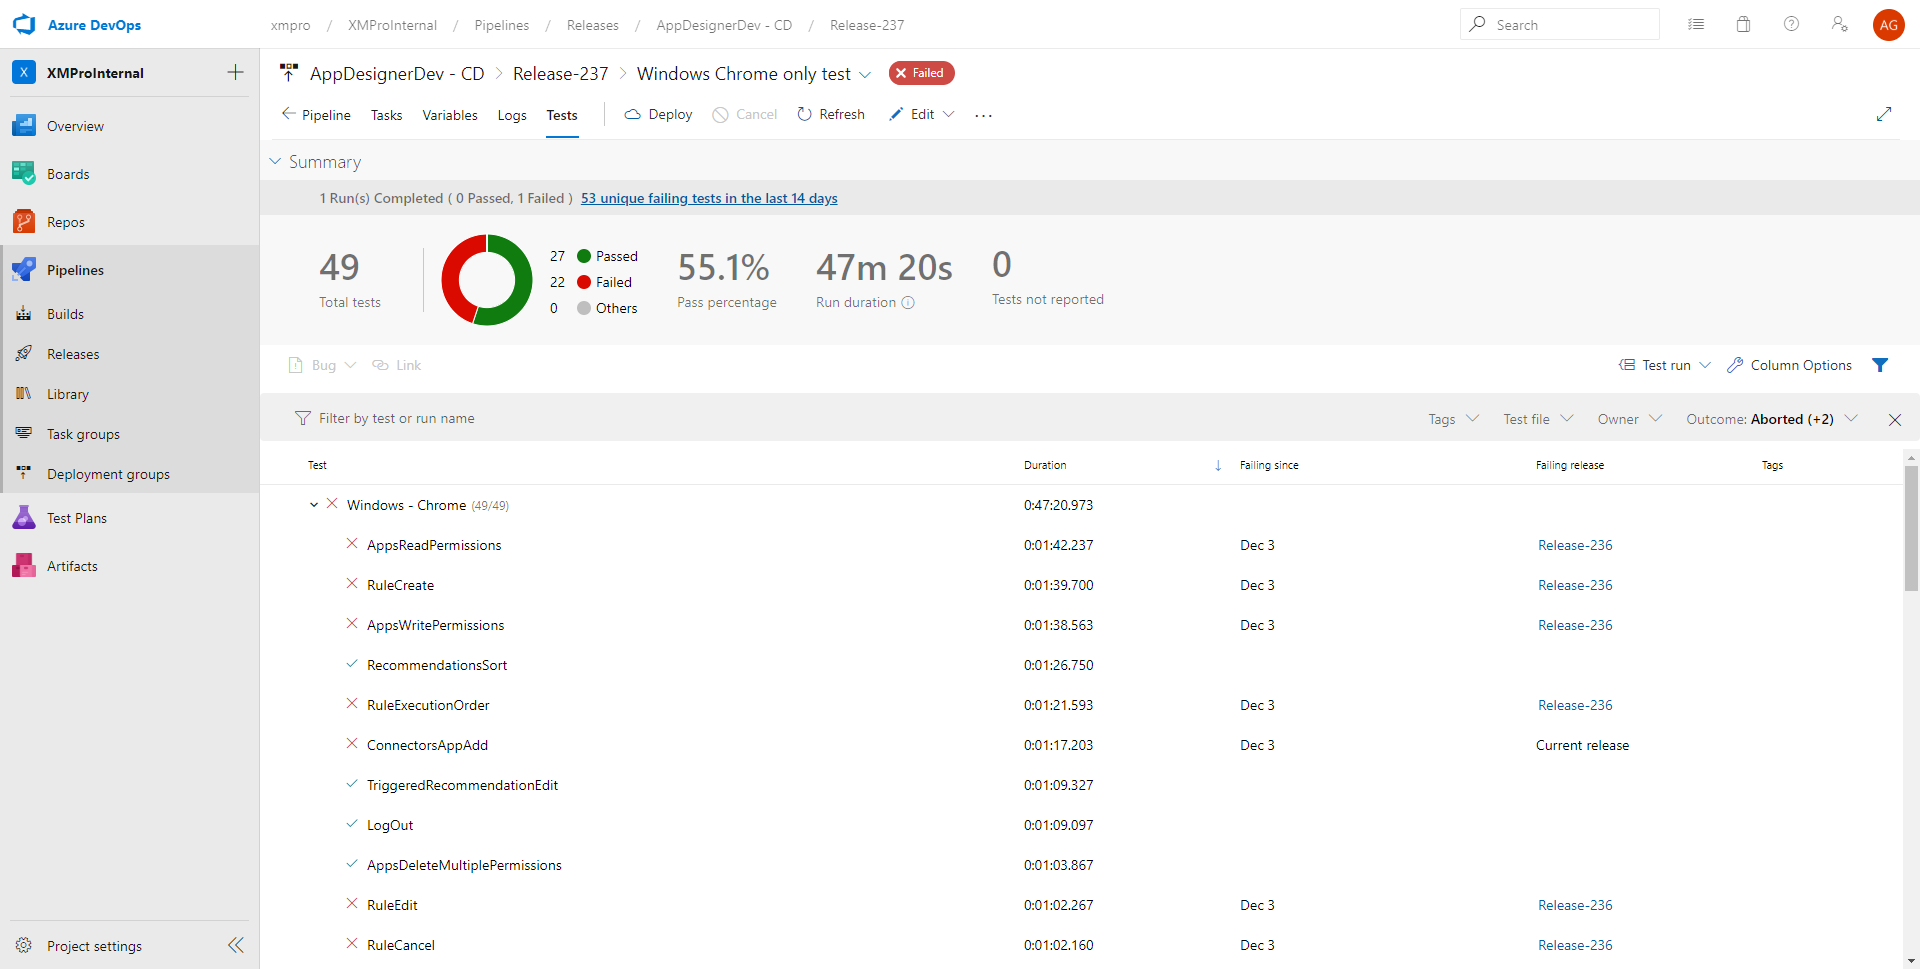
This page is mostly useful for quickly seeing what issues your tests have run into. It has less information that the Test Plan page, but it allows you to quickly preview any attachments your tests have made, like screenshots, by clicking a test result and clicking attachments, which the Test Plan page doesn’t.
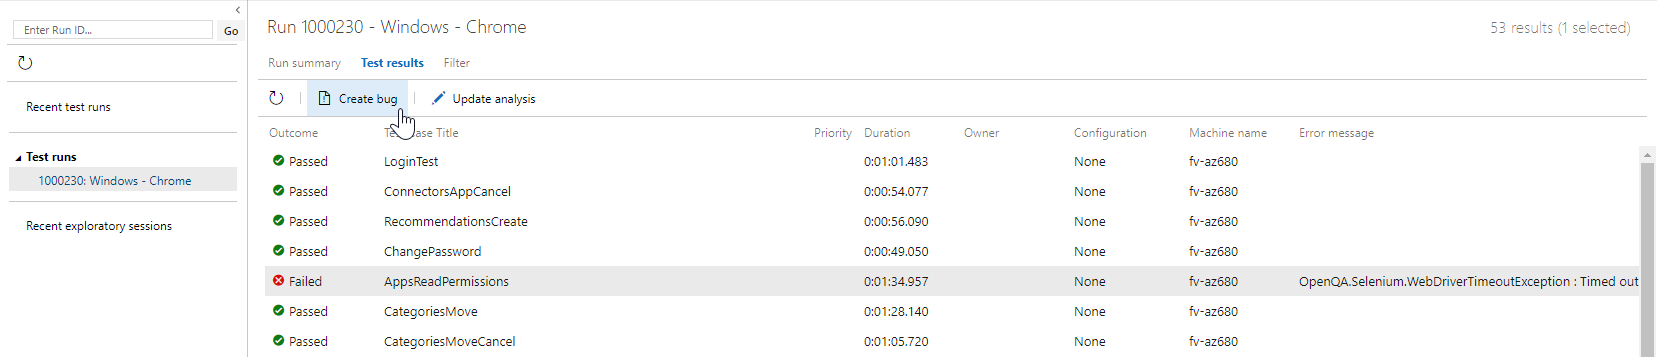
Test Plan Runs
You can access this page by going to Test Plans > Runs and double clicking the run you want to see.
The Run Results page will look something like this:
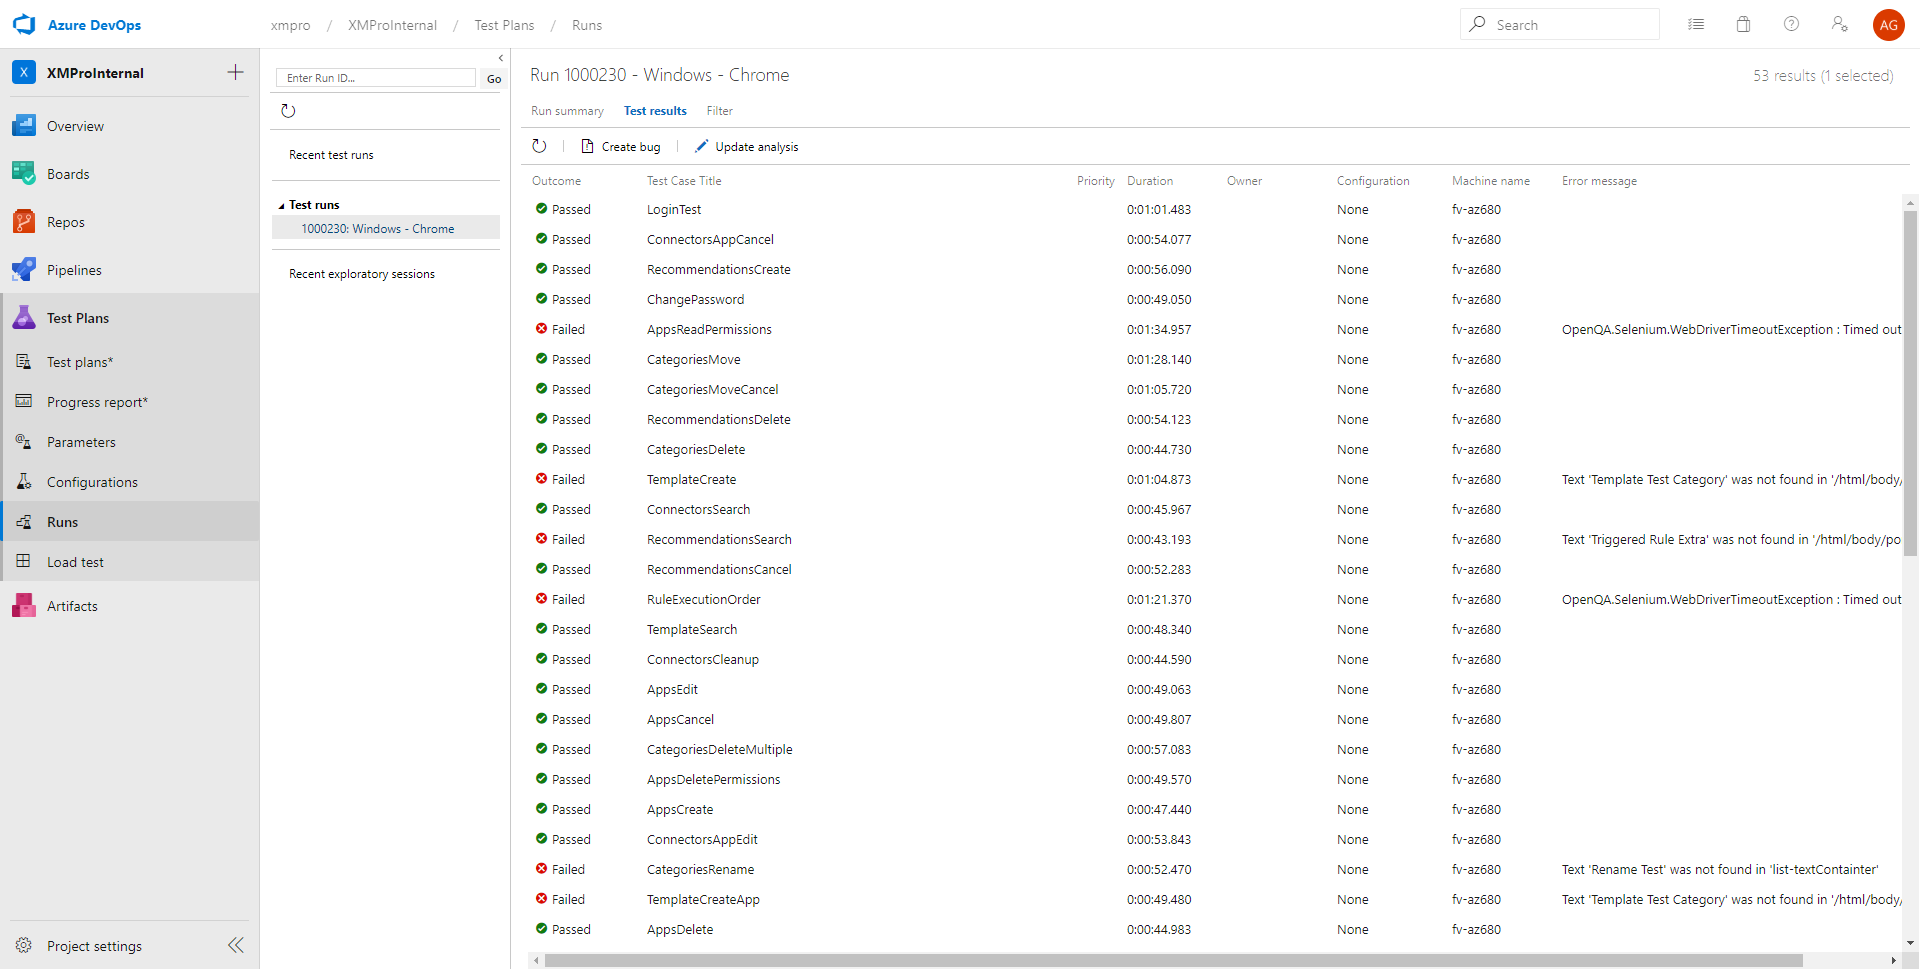
Double clicking a test will let you look at the test information.
Logging bugs from test results
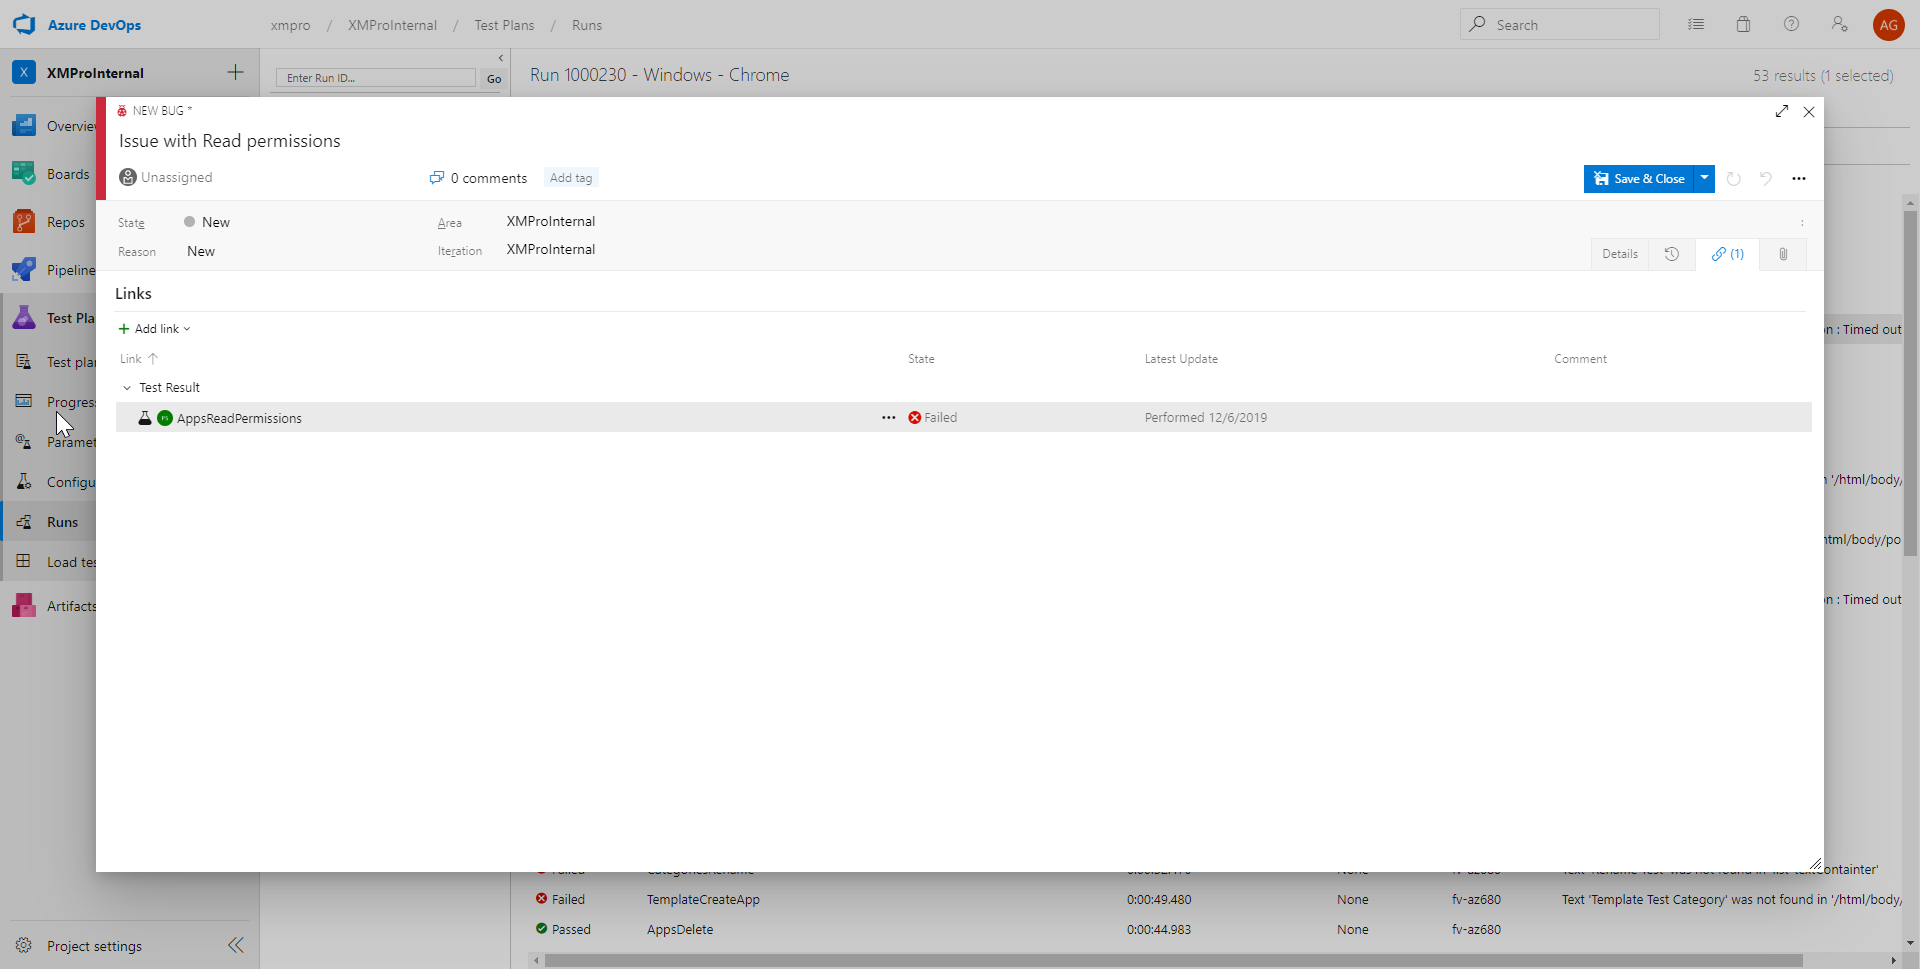
You can also log bugs directly from test results. This will automatically link the bug to the test results you have selected.
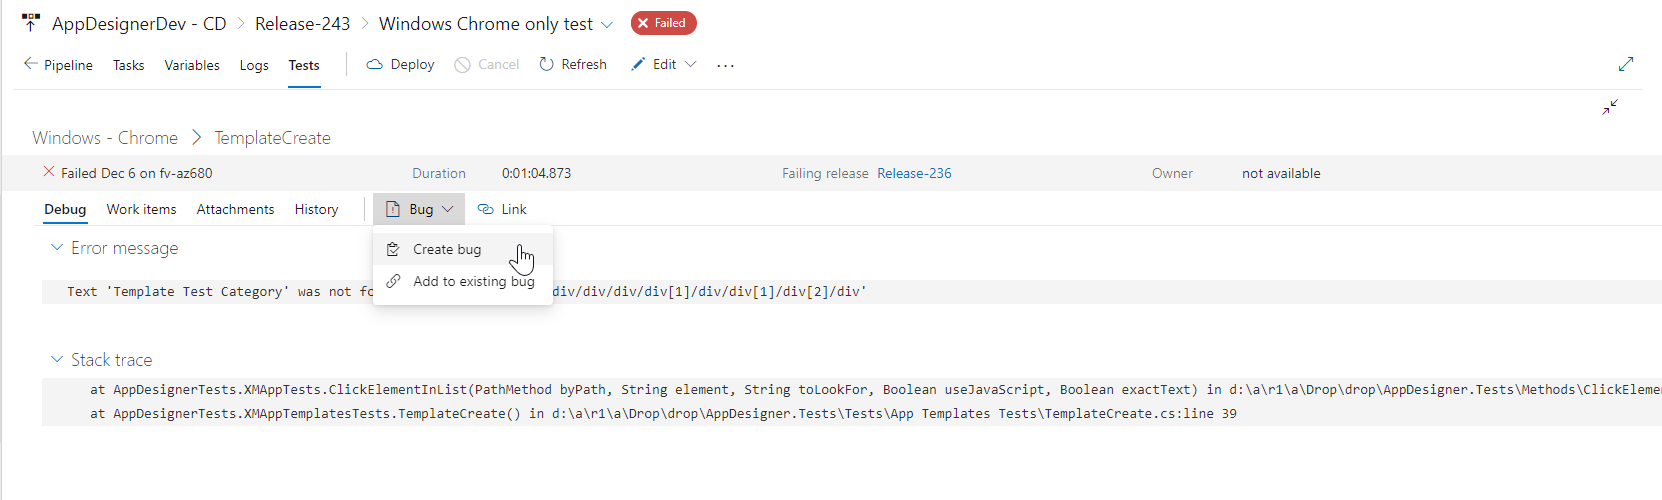
If you’re in the Release Pipeline’s test results, select the test you want, click the Full Screen button in the top right corner, then click Bug > Create Bug
If you are in the Test Plan Run’s result page, select the test you want and click the Create Bug button up the top.
Comments are closed.